
|
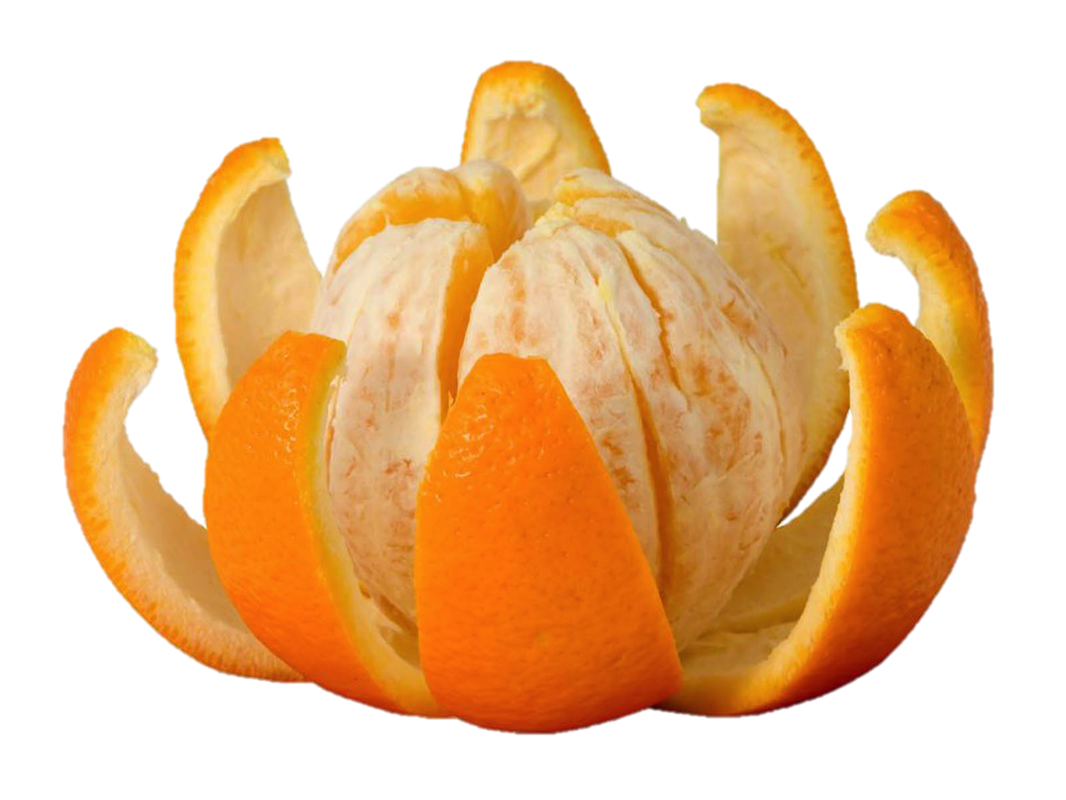
Imagine the Earth is an orange. If we want to see a map of the orange on a piece of paper, won't we have to peel it..? When we lay the orange peel flat, some parts of it are not exactly where we would like them to be. When we create maps, we have the same issue! For this reason, we have to stretch and distort the way the Earth looks to make it appear nicely on a piece of paper. Have you ever noticed that most maps look different, and that some countries change size from map to map? |

|
That's because different map makers use different

on their maps to make them look they way they want!

Goode's Homolosine Projection
Robinson Projection |

Mercator Projection |
Do you see how different the Earth can look when we project it and stretch it differently?
Take a look at Greenland (the area between Canada and Europe covered in snow)...
How does Greenland change from map to map?
What is the actual area of Greenland?
Take a look at Greenland (the area between Canada and Europe covered in snow)...
How does Greenland change from map to map?
What is the actual area of Greenland?
To better understand the way maps change and stretch the Earth's surface, try playing this game: mercator puzzle
As you play, ask yourself:
As you play, ask yourself:
- how does each country change in size as you move away from the center of the map on the Mercator Projection?
- How did this projection peel and stretch the Earth's surface like an orange?
- Why does Antarctica look so BIG on the Mercator Projection??
- Is Greenland really the size of Africa??
Now that we know a bit more about the way we project the Earth's surface onto a map, let's learn about what map-makers do today!

|
In the 21st century, most map makers have moved on from creating maps with paper and pens. Geography is currently entering a revolution with the growth of computer-based mapping software called Geographic Information Systems (GIS)! Map makers can now display information about the Earth or the people who live in its spaces and places that we can't see from plain photos of the Earth. This may make more sense when we take a look at some modern day maps... |
|
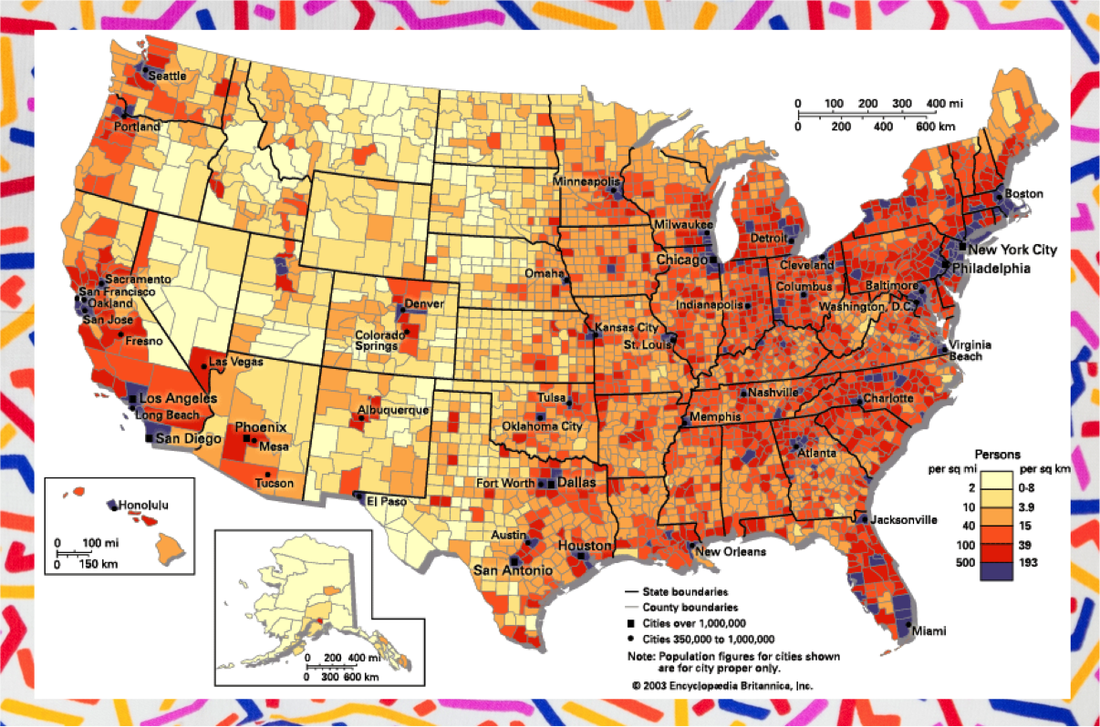
This is a map of the population density in the United States! On an image of the Earth, would we see this information? Map makers can use maps as powerful tools to show information and use geographic data in calculations and statistics! GIS softwares can now also help us make 3D versions of maps! |

|
The world needs more geographers!
Currently, geographers who use GIS are in HIGH demand! Are you interested in solving some of the world's problems by looking at the big picture? Consider working with GIS! Find out more here
